



A restaurant’s profitability is not decided only in the kitchen or the dining room; it is built first in the figures you track every day. Yet many managers still rely on gut feeling or the bank balance, without clear indicators.
By always using the same financial KPIs, you take back control of your margins, anticipate quiet periods and make informed decisions. This page details the seven essential indicators, how to interpret them and how to assemble them into a simple dashboard.
The 7 Financial KPIs Every Restaurateur Should Track to Manage Profitability
Reading time: ~13 min
1. Understanding restaurant profitability and your margins
2. The 7 financial KPIs to track to manage your restaurant
3. Build a simple financial dashboard for your restaurant
4. Frequently asked questions on restaurant profitability
Understanding restaurant profitability and your margins
Profitability rests on the balance between three blocks: revenue (turnover), variable costs (ingredients, staff tied to activity) and fixed costs (rent, insurance, subscriptions, administration).
Two structuring notions:
Food cost: the share of revenue spent on ingredients, ideally 25 to 35% excl. VAT for a traditional venue.
Prime cost: food cost + staff costs. Aim for 60 to 65% of revenue; beyond that, the ability to generate profit drops.
The seven KPIs detailed below measure these balances and spot margin leaks.
The 7 financial KPIs to track to manage your restaurant
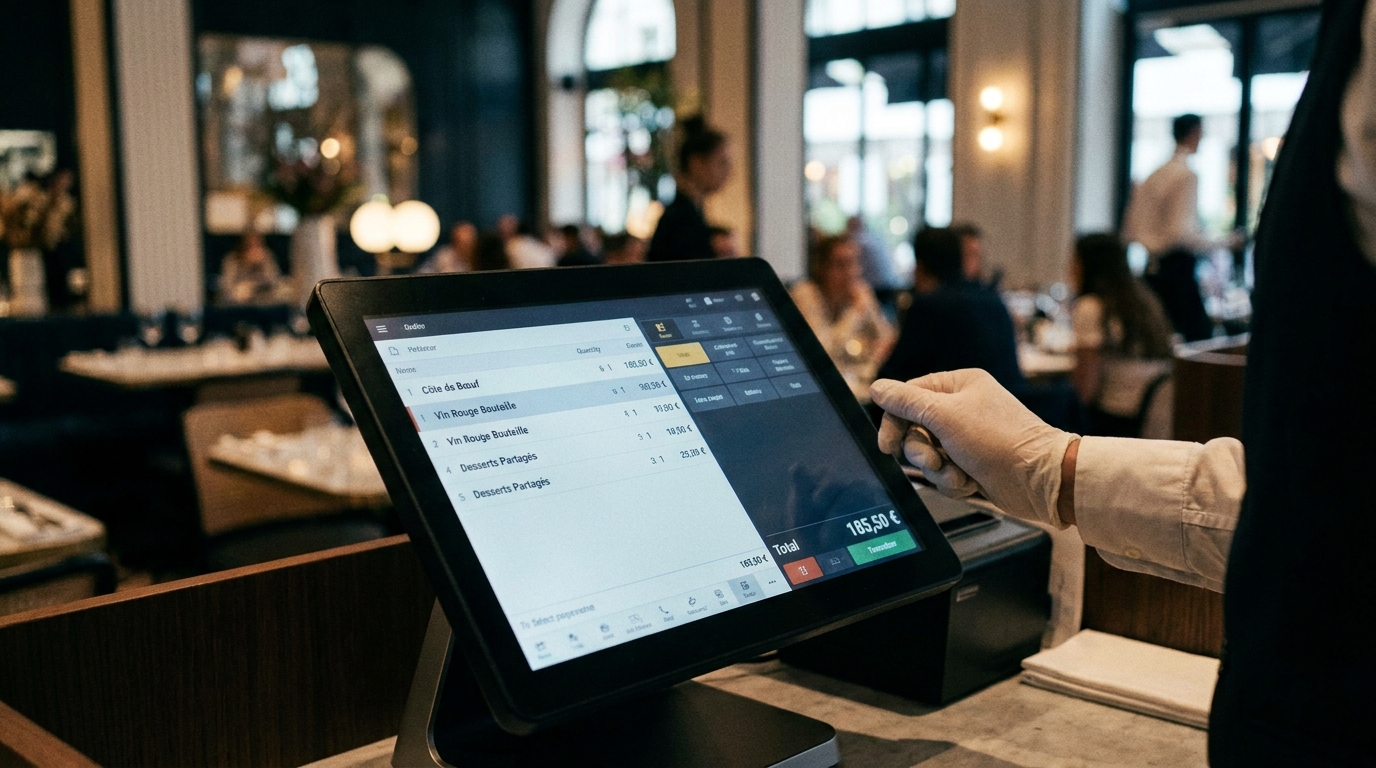
1. Revenue
Total revenue excl. VAT from dishes, drinks, menus and set menus over a given period. Tracked daily, it reveals trends, strong and weak days and the concrete impact of your marketing actions.
Best practices: compare each day with the same weekday and the same day the previous year; break it down by service (lunch/dinner); link variations to menu or event changes.
2. The average ticket
Calculation: revenue excl. VAT ÷ number of covers. It shows the average spend per guest and reflects your ability to generate add-on sales. To increase it: menu engineering, in-room sales scripts and a digital menu with contextual recommendations, such as menu engineering with AI.
3. Gross margin
Formula: (revenue excl. VAT − food cost) ÷ revenue excl. VAT × 100. Usual target: 65 to 75%. It must cover fixed costs and flag any problem of waste, theft or cost increases that have not been passed on.
Levers: regularly recalculating recipe sheets, renegotiating with suppliers, reducing waste.

4. Gross profit
Absolute value: revenue excl. VAT − actual cost of ingredients. It shows the value created before other costs and lets you compare periods or services (lunch, dinner, weekend) to adjust hours, staffing and offers.
5. Net margin
Formula: (net result − total costs) ÷ revenue excl. VAT × 100. Above 10% in catering, performance is already considered good. If gross margin is fine but net margin is low, fixed costs or staff costs are often the cause.
6. Staff cost ratio
Formula: payroll costs ÷ revenue excl. VAT × 100. Aim for 30 to 45% depending on the type of venue. Close tracking helps you adapt schedules, optimise contracts (full-time, part-time, extras) and automate certain tasks without sacrificing the guest experience.
7. Break-even point
The minimum revenue level that covers all costs. It is based on fixed costs and the contribution margin rate. Knowing this threshold gives you a clear target per day or week, serves for simulations (rent increase, new hire) and guides decisions on opening or exceptional closure.
Build a simple financial dashboard for your restaurant
How to structure your dashboard
The ideal is a single page, readable in a few minutes. A spreadsheet is enough, but digital tools can automatically feed in some data.
• Periods tracked: day, week, month, rolling year.
• Indicators: revenue, covers, average ticket, food cost, gross margin, staff costs, net margin, break-even point.
For each KPI, note the actual value, the target, the gap and a quick action if the gap is significant.
Use digital and data to track your KPIs
The fresher the data, the more relevant the dashboard. A digital menu like Appero (QR code, product analytics, language breakdown) feeds your menu engineering, improves add-on sales and keeps digital costs predictable thanks to the SaaS subscription.

Frequently asked questions on restaurant profitability
How often should you track these 7 KPIs?
Revenue, covers and average ticket should be checked every day. Gross margin, staff costs, net margin and break-even point are better checked weekly or monthly. Block a fixed slot, for example Monday morning, to update the dashboard.
Which KPIs should I prioritise if I am starting out?
Start with: revenue, covers, average ticket, overall food cost and staff cost ratio. Once you have mastered these basics, add gross margin, prime cost and break-even point.
How do I connect these KPIs to my menu and the guest experience?
KPIs guide the choice of prices, products to highlight or remove, add-on sales scripts and useful investments. Cross-check financial figures with guest behaviour data from menu engineering for decisions aligned with the real experience in the dining room.
Can a digital menu really improve my profitability?
Yes: it clarifies the menu through visuals, offers relevant add-on sales, delivers detailed data on the dishes viewed and cuts printing costs. Combined with a financial dashboard, it becomes a concrete lever to grow the average ticket and margins without harming the human service.
By regularly tracking these seven KPIs and building them into a living dashboard, you have a solid base to manage your restaurant’s profitability. An intelligent, data-driven digital menu completes this setup by quickly activating the right levers on your menu and your add-on sales. To go further, explore the blog dedicated to restaurateurs and discover the solutions on offer.